[Infographic] Metrics that Drive Success for RIAs

Unlocking your firm’s potential requires more than just managing wealth; it demands an understanding of essential operational metrics. Below the infographic, we’ll walk you through some of these critical numbers and share practical ways to use them to boost your business. Ready to get a handle on your firm’s success? Let’s dive in.
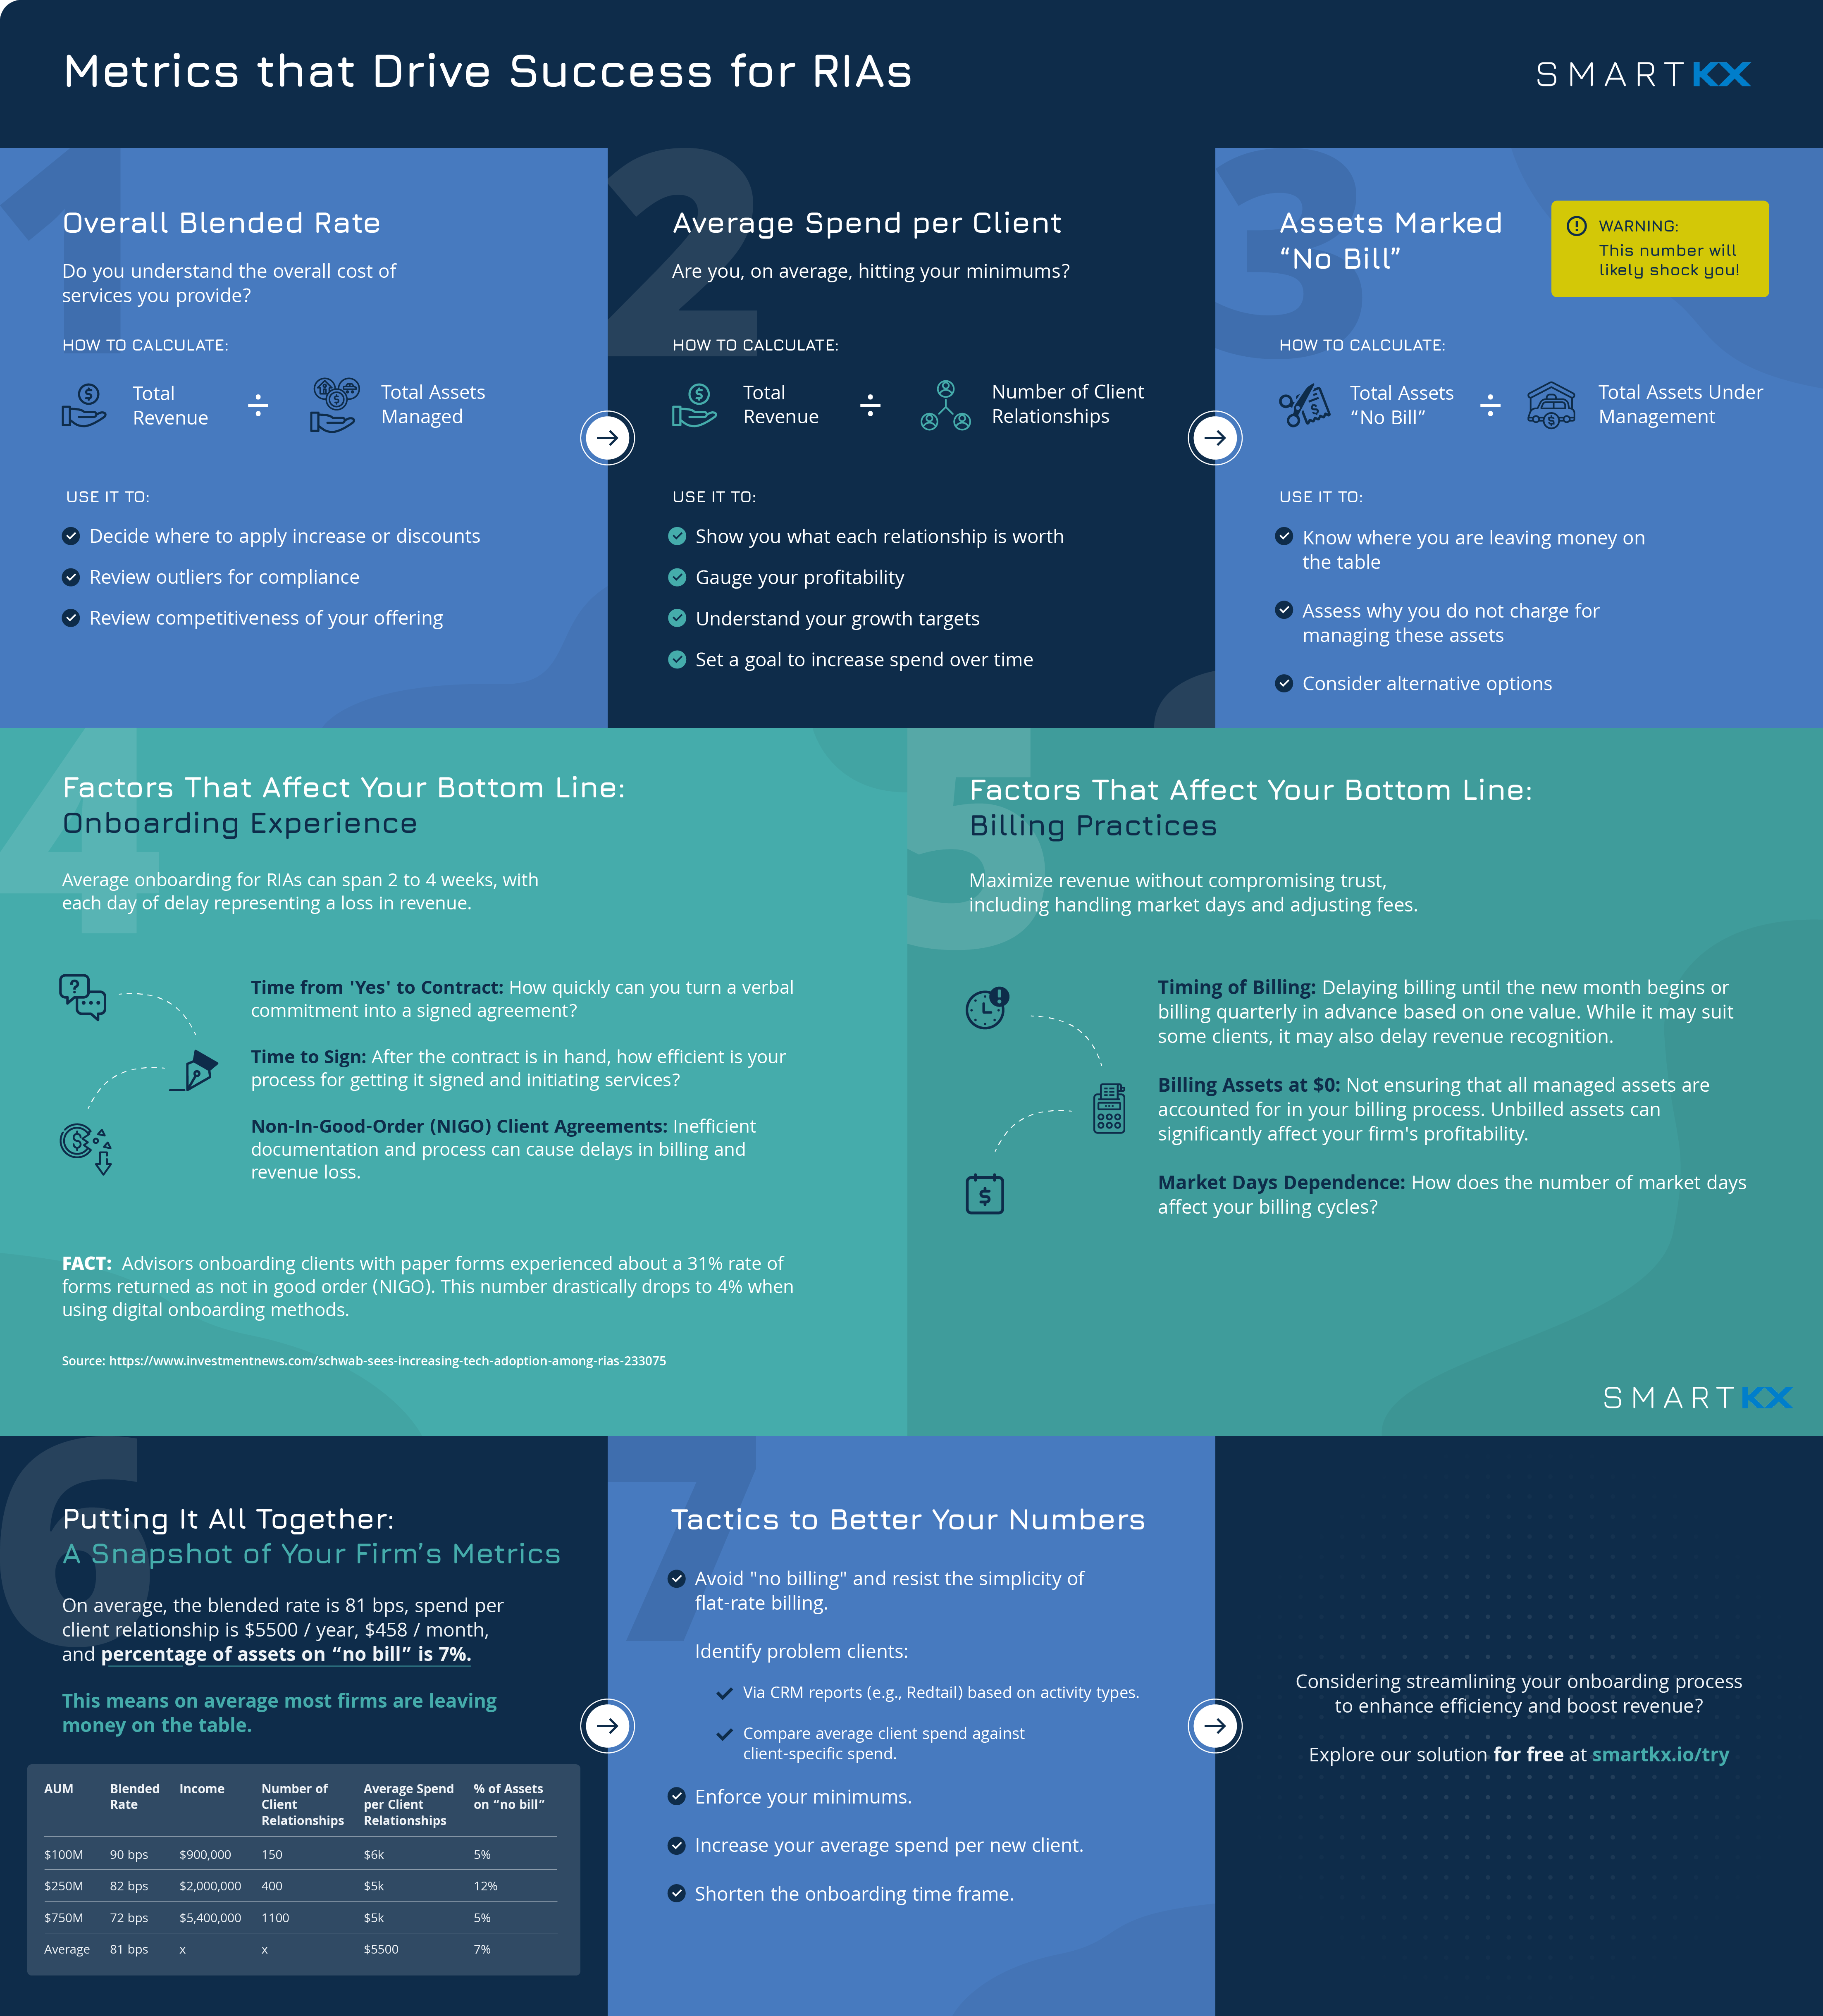
How to Calculate Your Overall Blended Rate

The Overall Blended Rate is a metric indicating the overall costs of the services you provide. It is calculated by dividing Total Revenue by Total Assets Managed.
Use this rate to make informed decisions on 1) where to increase fees or offer discounts, 2) Review outliers for compliance, and 3) Evaluate competitive offerings in the market. An optimized blended rate not only speaks to the health of your business but also to your competitiveness in the marketplace.
Understanding the Average Spend per Client

The Average Spend per Client metric is calculated by dividing Total Revenue by the Number of Client Relationships.
This metric is a clear indicator of whether you are, on average, hitting your minimums on a per-client basis. Use this metric to demonstrate the value of each client relationship, assess your profitability, comprehend your growth targets, and establish a goal to incrementally increase client spending over time.
Assets Marked “No Bill” (Warning: This Will Shock You!)

A startling metric many RIAs face is the Assets Marked “No Bill”. The calculation is straightforward: Total Assets “No Bill” divided by Total Assets Under Management.
This metric highlights revenue that is potentially being overlooked or if there is a cost associated with managing uncharged assets.
Factors That Affect Your Bottom Line: Onboarding Experience
The onboarding experience is often a silent culprit in revenue loss. With the average onboarding time ranging from 2 to 4 weeks, each day’s delay equates to lost revenue. The time from a verbal agreement to a signed contract, the efficiency of the signing process, and the prevalence of Non-In-Good-Order (NIGO) client agreements are all factors that can bottleneck your revenue stream.
Consider this: Advisors onboarding clients with paper forms experienced about a 31% rate of forms returned as not in good order (NIGO). This number drastically drops to 4% when using digital onboarding methods. (Source: https://www.investmentnews.com/schwab-sees-increasing-tech-adoption-among-rias-233075)
Factors That Affect Your Bottom Line: Billing Practices
Maximize revenue without compromising trust, including handling market days and adjusting fees:
- Timing of Billing: Delaying billing until the new month begins or billing quarterly in advance based on one value. While it may suit some clients, it may also delay revenue recognition.
- Billing Assets at $0: Not ensuring that all managed assets are accounted for in your billing process. Unbilled assets can significantly affect your firm’s profitability.
- Market Days Dependence: How does the number of market days affect your billing cycles?
Putting It All Together: A Snapshot of Your Firm’s Metrics 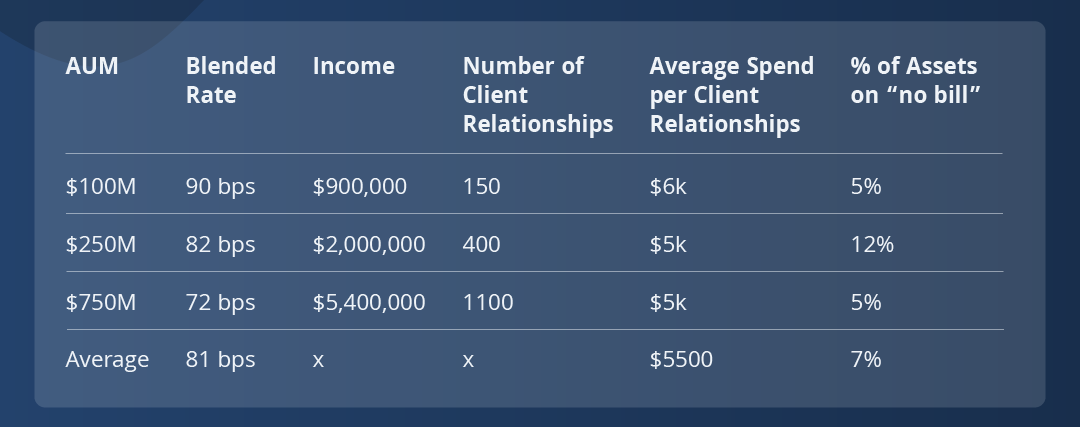
At an average blended rate of 81 basis points, a yearly client spend of $5,500, and 7% of assets not billed, it’s clear that many firms could be earning more. These metrics are key indicators for pinpointing where you can enhance your firm’s financial performance.
Tactics to Better Your Numbers
An advisory firm’s financial good health is continuous and demands a strategic approach to metric analysis and application. By leveraging the insights provided by these key metrics, RIAs can make data-driven decisions that ensure future success:
- Avoid “no billing” and resist the simplicity of flat-rate billing.
- Identify problem clients by comparing average client spend against client-specific spend.
- Enforce your minimums.
- Increase your average spend per new client.
- Shorten the onboarding time frame.
For a visual summary of these insights and to keep them handy for reference, download our detailed infographic. This tool distills all the key metrics and strategies into an easy-to-understand format, perfect for quick reviews and sharing with your team!